| THUNDERPLOT | Overview | Docs | Download | Buy |
Thunderplot User's Manual
Data Sources
«Text file» Data Source
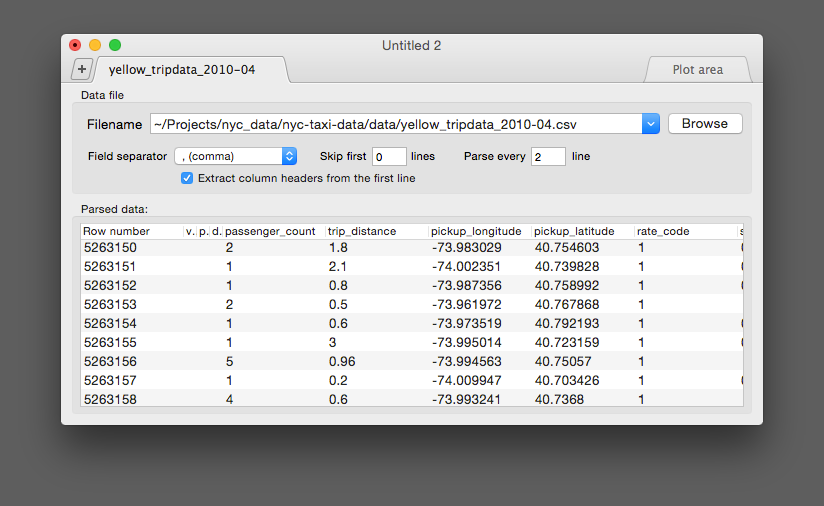
To load your data from a text file, click the  button and select «Text File»
After selecting this option, a new window and tab will appear. Note that each data file has its own tab. You can remove a data source by clicking [x] button in its tab.
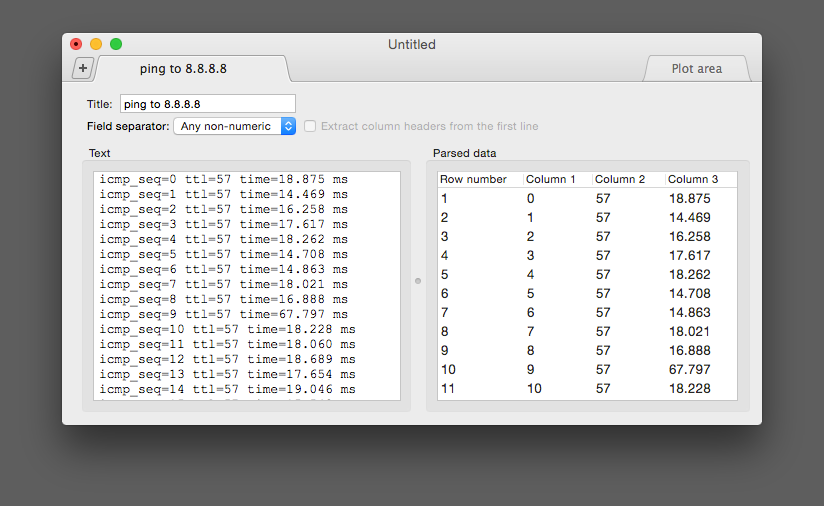
If the "Any non-numeric" field separator used, Thunderplot extracts all numbers from the input file.
For example, the following line:
"pts: 5002, brightness: 23 (12%)"
will be parsed as:
"5002 | 23 | 12"
Reloading your Data Source
If you modify your data file (e.g. add or delete rows, change numbers, etc.), you need to reload the data source in Thunderplot. To do so, you go Data Source > Reload or use the keyboard shortcut
«Editor» Data Source
You can type your data in «Editor» data source — it can be useful if you need to copy and paste text from a Terminal window or a Web page. Additionally, it eliminates the extra steps of having to create a separate data file.
To input your data into the integrated text editor, click the button and select «Editor».
Start inputting your data on the left side of the page, where each carriage return (i.e. click the «Enter» button) signifies the end of a line and, thus, starts a new row. The «Editor» data source parses manually-entered text the same way as the «Text File» data source does. Non-numeric characters are recognized as delimiters between data columns.
Creating a Plot
Creating and Deleting Curves
To create a new curve, click the «Plot Area» tab on the right side of the screen, and then click the  icon in the lower left corner of the window. Note that a «curve» represents ONE data graph in the plot area. You can plot multiple curves by clicking the icon again, or delete a curve by clicking the
  icon at the top of the curve’s dialog box.
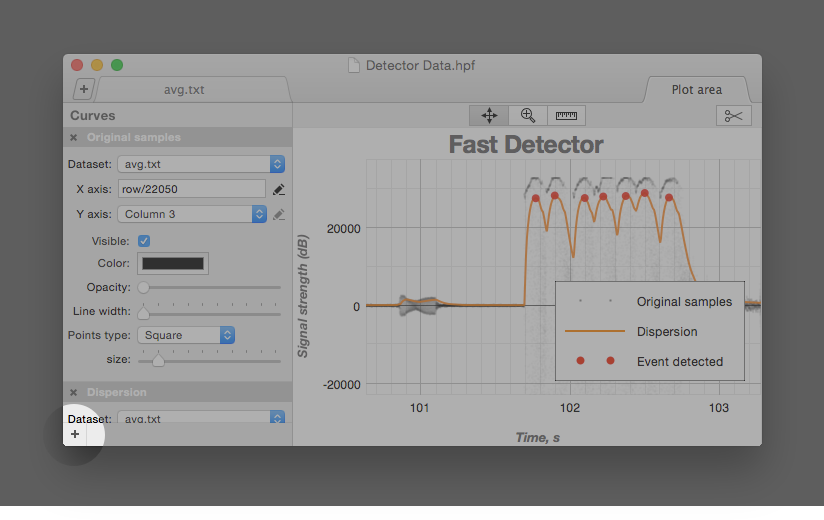
Curve Parameters
- Select the data set (i.e. data source) for the curve
- Identify columns for the X and Y coordinates of the curve’s points
- Make the curve visible or invisible
- Change the line color and opacity
- Modify the line and point styles
- Set name of the curve. Curves with user-defined names appear in the legend
Curve Expressions
You can also write expressions for a curve’s X and Y coordinates. To input an expression, click the  icon next to either the X or Y combo-box. The combo-box will then be replaced by a text field, so that you can input the expression.
Following operators can be used in expressions:
The following variables recognized by Thunderplot:
- column:
c1 ,c2 ,c3 , etc.; - row number:
row ; - the number PI (3.14159...):
pi ; - eulerian number (2.17828...):
e . - nan, «not a number»:
nan
- trigonometric:
sin ,cos ,tan ,asin ,acos ,atan ; - hyperbolic:
sinh ,cosh ,tanh ,asinh ,acosh ,atanh ; log (same aslog10 ),log2 ,ln ;sqrt : square root;exp : exponential function;abs : absolute value of argument;mod(a, b) : modulo operation (i.e. the remainder of the division ofa byb );delta(x) : the difference between the previous and current value;integrate(x) : cumulative sum of values;mean(x, n) : moving average ofx , wheren is series size;percentile(x, p, n) : moving percentile ofx , wherep is percent (1..99)n is series size;highpass(x, a) : high-pass filter of values ofx , wherea is discrete equivalent of time constant;lowpass(x, a) : low-pass filter of values ofx , wherea is discrete equivalent of time constant.
mktimestamp( : makes UNIX timestamp (number of seconds since 1970) from given date components;year ,mon ,day ,hour ,min ,sec )year( : extract year from the given timestamp;timestamp )month( : month, 1=January;timestamp )dayofmonth( : day of month, 1...31;timestamp )dayofweek( : day of week, 1=Monday;timestamp )dayofyear( : day of year, 1...366;timestamp )hour( : hour, 0...23;timestamp )minute( : minute, 0...59;timestamp )second( : second, 0...59.9(9);timestamp )
Axis
You can change axis type in
- No ticks: no ticks, no grid;
- Numeric (default): this axis just shows numeric representation of the values;
- Timeline: handles values as UNIX timestamps, so the value 1406467828 will be shown as 2014-07-27, 9:30:28;
- Logarithmic;
- Pseudo log — a combined log/linear axis that shows negative and zero values. Instead of
log() function it usespseudolog :pseudolog(x) = log(x) , x >= 10 x/10 , -10 > x > 10 -log(-x) , x <= -10 Here's the example:
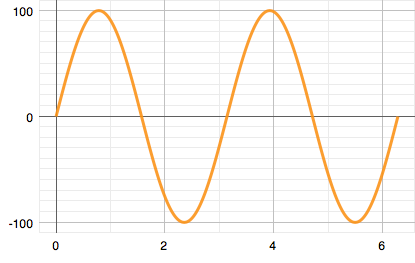
sin(x) function on linear axis:
sin(x) function on log axis:
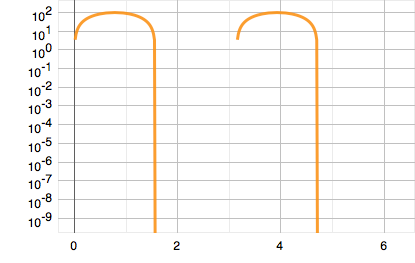
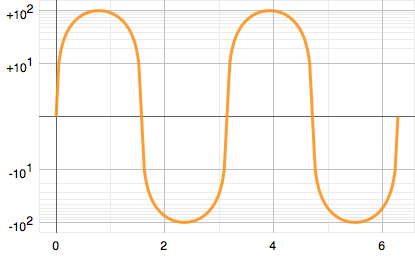
sin(x) function on pseudo log axis:
Titles
Title of plot and axis can be specified in
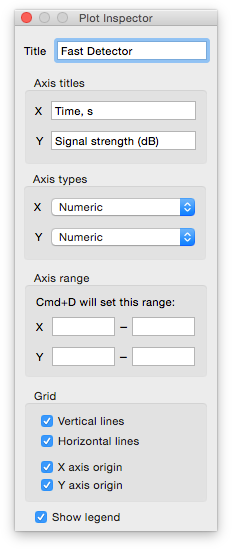
If a plot or axis title is not empty, it will be shown automatically.
Legend
The legend can be enabled/disabled in
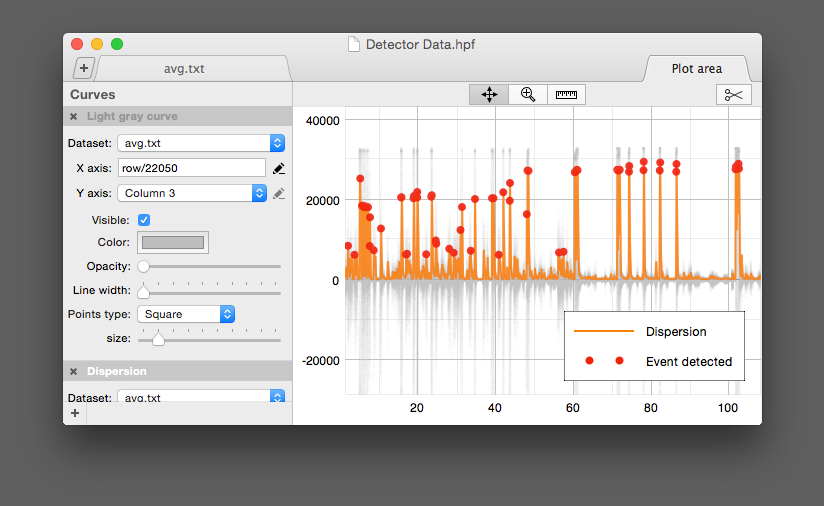
(Note, the first «Light gray curve» doesn't appear in the legend.
Navigating the Plot Area
Thunderplot features several convenient modes for panning, zooming and measuring your data.
Panning and Zooming
You can pan across the plot area dragging your mouse across the screen (while holding down the left mouse button). To zoom into or out of the plot area, you can use mouse wheel. Also
Axis titles and plot header
You can add titles for axis and whole plot area in plot inspector (press
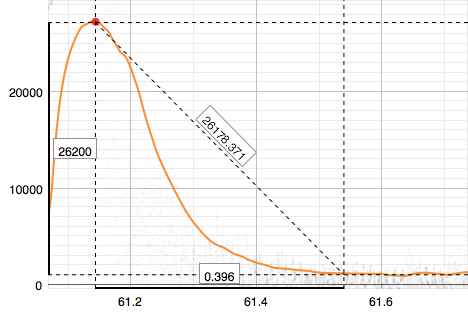
The Ruler
By clicking the «Ruler»  the plot area gets switched to «Ruler» mode. Width and height appears at the corresponding axis; distance appears at the line that connects start point and mouse cursor (if X and Y are the same and word «distance» does have sense):
Taking Snapshots
 — Saves snapshot to a file. This is the same as going to View > Make Snapshot to File.
— Opens snapshots folder in Finder.
— Copies snapshot to your clipboard. This is the same as going to View > Make Snapshot to Clipboard.
The default snapshots folder is ~/Pictures (or Thunderplot’s sandbox folder in MacAppStore version).
By default, snapshots are saved as PNG files. You can change snapshots folder and file type in Thunderplot Preferences.
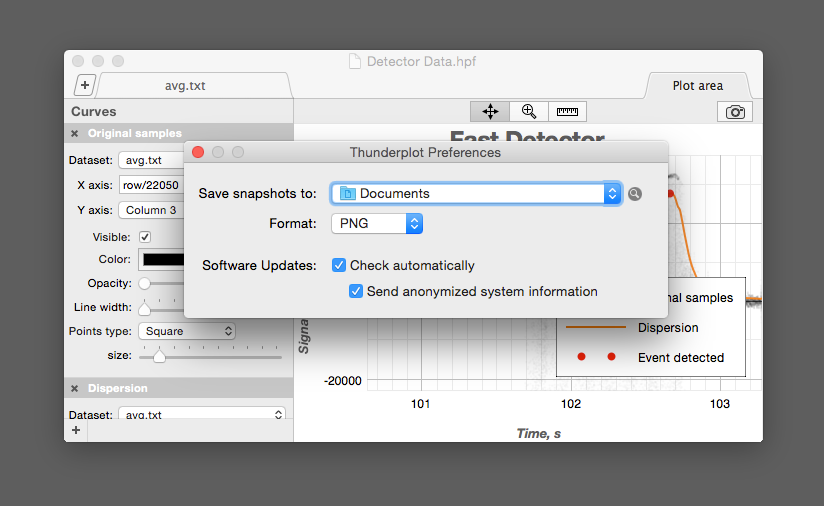
Automatic Checking for Updates
To automatically check our servers for Thunderplot updates, go to Thunderplot > Preferences and ensure that Check Automatically is enabled.
You can help the project by allowing updater to send anonymized information about your system, such as:
- Mac OS X version
- CPU type/subtype
- Mac model
- Number of CPUs (or CPU cores, in the case of something like a Core Duo)
32-bit vs.64-bit - CPU speed
- RAM size
- User’s preferred language